
The chain of overlapping methods by which astronomers establish a distance scale for objects in the universe, from nearby planets to the most remote quasars and galaxies. At every step of the distance ladder, errors and uncertainties creep in.
Each step inherits all the problems of the ones below, and also the errors intrinsic to each step tend to get larger for the more distant objects; thus the spectacular precision at the base of the ladder degenerates into much greater uncertainty at the very top.
 |
Distances within the Solar System are known to extreme accuracy by a variety methods, including the motions of the planets in the sky, radar, and timing of signals from interplanetary probes. Distances to stars within a couple of thousand light-years come from various geometrical methods; the most accurate values are those based on measurements of the annual parallax of about 10,000 nearby stars made by the Hipparcos satellite. The moving cluster method can be applied over a similar range, while main-sequence fitting works with open clusters out to a distance of about 60,000 light-years.
Beyond the Milky Way Galaxy, distances can be established most reliably using the period-luminosity relation of Cepheid variables, backed by similar observations of other bright stars whose intrinsic brightness is reasonably well-known, including RR Lyrae stars and novae. This method can be applied out to the limit at which Cepheids and other individual stars can be distinguished inside their host galaxies - up to about 100 million light-years. For more distant galaxies, standard candles brighter than Cepheids are needed.
These include globular clusters and Type Ia supernovae, which can be calibrated as distance indicators using Cepheids in relatively nearby galaxies and then applied further afield-up to about 200 million light-years for globulars and out to at least 3 billion light-years for supernovae. At the furthest limits, only whole galaxies are detectable, so methods such as the Tully-Fisher relation and Faber-Jackson relation are used, which link measurable properties of galaxies, or clusters of galaxies, to their luminosity.
Extragalactic distance indicators enable estimates to be made of the Hubble constant, a measure of the rate at which the universe as a whole is expanding. Observation of the redshift of a remote galaxy or quasar then supplies the object's distance. Over time the accuracy to which the Hubble constant is known has improved dramatically. The most recent determination, using data from the Spitzer Space Telescope has narrowed the uncertainty down to just 3 percent.

Stellar clusters are important empirical astrophysical laboratories
since they represent a group of stars at a common distance which
were born at a common time. Differences in stellar evolutionary
rates then allow the HR diagram to be filled out after a few million
years of stellar evolution. Let's suppose that intermediate
age stellar clusters, which contain a few thousands of stars, contain
a certain type of star that can serve as a standard candle but that
this certain type of star is not contained in the currently available
trigonometric parallax samples. Let's further suppose that this star
is intrinsically bright and hence can be seen to large distances.
If we can then determine the distance to the cluster containing that
star we can then calibrate its absolute brightness. We can then use
that star to probe larger distances.
There are basically three types of stars found in stellar
clusters that are useful to determine distances in our own galaxy as
well as in external galaxies.
These stars are:
 RR Lyrae variable
stars. These variable stars typically have
pulsational periods of a few days and there is no correlation between
pulsational period and luminosity. These stars are evolved stars and
are found in the oldest clusters, like globular clusters.
Although there is still some
disagreement over their absolute magnitude (more fully discussed below),
these stars have Mv
RR Lyrae variable
stars. These variable stars typically have
pulsational periods of a few days and there is no correlation between
pulsational period and luminosity. These stars are evolved stars and
are found in the oldest clusters, like globular clusters.
Although there is still some
disagreement over their absolute magnitude (more fully discussed below),
these stars have Mv
 +0.5 and hence can be used as
a distance indicator out to a distance of
1 Mpc at which point they have
an apparent magnitude > 25.0 mag, the limit of ground-based telescopes.
Cepheid Variable
stars. These variable stars show a strong
relationship between intrinsic luminosity and pulsational period. In
practice, this relationship is empirically defined by Cepheids in the
Large Magellanic Cloud (LMC) and hence an accurate
distance to the LMC would
calibrate the relationship.
+0.5 and hence can be used as
a distance indicator out to a distance of
1 Mpc at which point they have
an apparent magnitude > 25.0 mag, the limit of ground-based telescopes.
Cepheid Variable
stars. These variable stars show a strong
relationship between intrinsic luminosity and pulsational period. In
practice, this relationship is empirically defined by Cepheids in the
Large Magellanic Cloud (LMC) and hence an accurate
distance to the LMC would
calibrate the relationship.
However, there is some concern that the
Cepheid Period-Luminosity relationship has a dependence on metallicity
and hence the LMC relationship may not be universal. Cepheids are also
found in young, open clusters in our Galaxy but, as we shall see,
calibrating their intrinsic luminosity in those clusters is quite
difficult. For the longer period Cepheids (periods of a month or so)
the intrinsic luminosity is quite large, Mv
-7. Hence, ground
based measurements can detect this population out to a distance of
4 Mpc. However, the improved angular resolution available with
HST has allowed individual Cepheid Variables to be detected out to
distances of 15 Mpc.
-7. Hence, ground
based measurements can detect this population out to a distance of
4 Mpc. However, the improved angular resolution available with
HST has allowed individual Cepheid Variables to be detected out to
distances of 15 Mpc.
In January 1997 a conference was held in which some of the first
Hipparchos results were made public and discussed. The most relevant
of these new results comes from Feast and Catchpole who discuss
a parallax sample of 26 Cepheids. These stars are at the very limit
of the useful range of accurate parallax measurement of Hipparcos
and therefore the measurements are potentially subject to systematic
error. Notwithstanding this, Feast and Catchpole derive a zero point
for the Cepheid PL relation which is approximately 0.2 mag brighter
than previous measurements indicate.
This has significant consequences
for the Cepheid distance scale that we describe later in this chapter.
However, there is still much uncertainty in this new zeropoint estimate
as 1) there may be systematic errors in the parallax measurements themselves
for these large distances, 2) Feast and Catchpole derive reddening
estimates to the Cepheids based only on Blue and Visual photometry, 3)
they assume a metallicity correction of -0.04 mag where the correction
comes from the Laney And Stoble (1992) metallicity calibration and
the metallilcity of the individual Cepheids is inferred from the B-V
color. Unfortunately, the reddening and metallicity corrections are
degenerate when only B-V is used. Hence, this apparent change in the
zeropoint of the Cepheid PL relation requires additional confirmation.
The brightest Red
Supergiants. These are young massive stars
which are in a short-lived evolutionary phase at the tip of the Red Giant
branch. There luminosities can approach Mv = -9 and
hence ground
based measurements can detect them in Virgo cluster galaxies and beyond.
To take advantage of these stellar distance indicators one has to accurately
calibrate their absolute magnitudes by measuring good distances to nearby
clusters which contain these objects. In the case of RR Lyraes, this
means globular clusters and there essentially are no nearby globulars.
For Cepheids and M-supergiants, young, open clusters contain a handful
of these objects. These clusters are generally located in the plane
of the Galaxy and hence are reddened by interstellar dust.
Main Sequence Fitting
Main Sequence Fitting
| Remember that star spend most of their lives on the main sequence. If we have a well-calibrated main sequence, we can use it to get distances to distant star clusters. |  |
 |
Clusters |
 |
 |
 |

Pulsating variables are stars that show periodic expansion and contraction of their surface layers. Pulsations may be radial (where the star remains spherical in shape) or non-radial (where the star may become non-spherical). Pulsating variables may be distinguished by their pulsation period, their mass, their age, and the nature of their pulsations. Pulsating variable stars may be subdivided into 5 classes.

Cepheids as Distance Markers
RR Lyrae Stars
RV Tauri Stars
Long Period and Irregular Variables
Observation Techniques of the Baade-Wesselink Method
The two observation techniques used for the interferometric version of the Baade-Wesselink method are high-resolution spectroscopy (left) and interferometry (right). The former provides the radial velocity curve over the pulsation cycle of the star. When integrated, this in turn provides the linear radius variation of the star (in metres). The interferometric observations document variation of the star's angular radius. The ratio of these two quantities gives the distance of the Cepheid.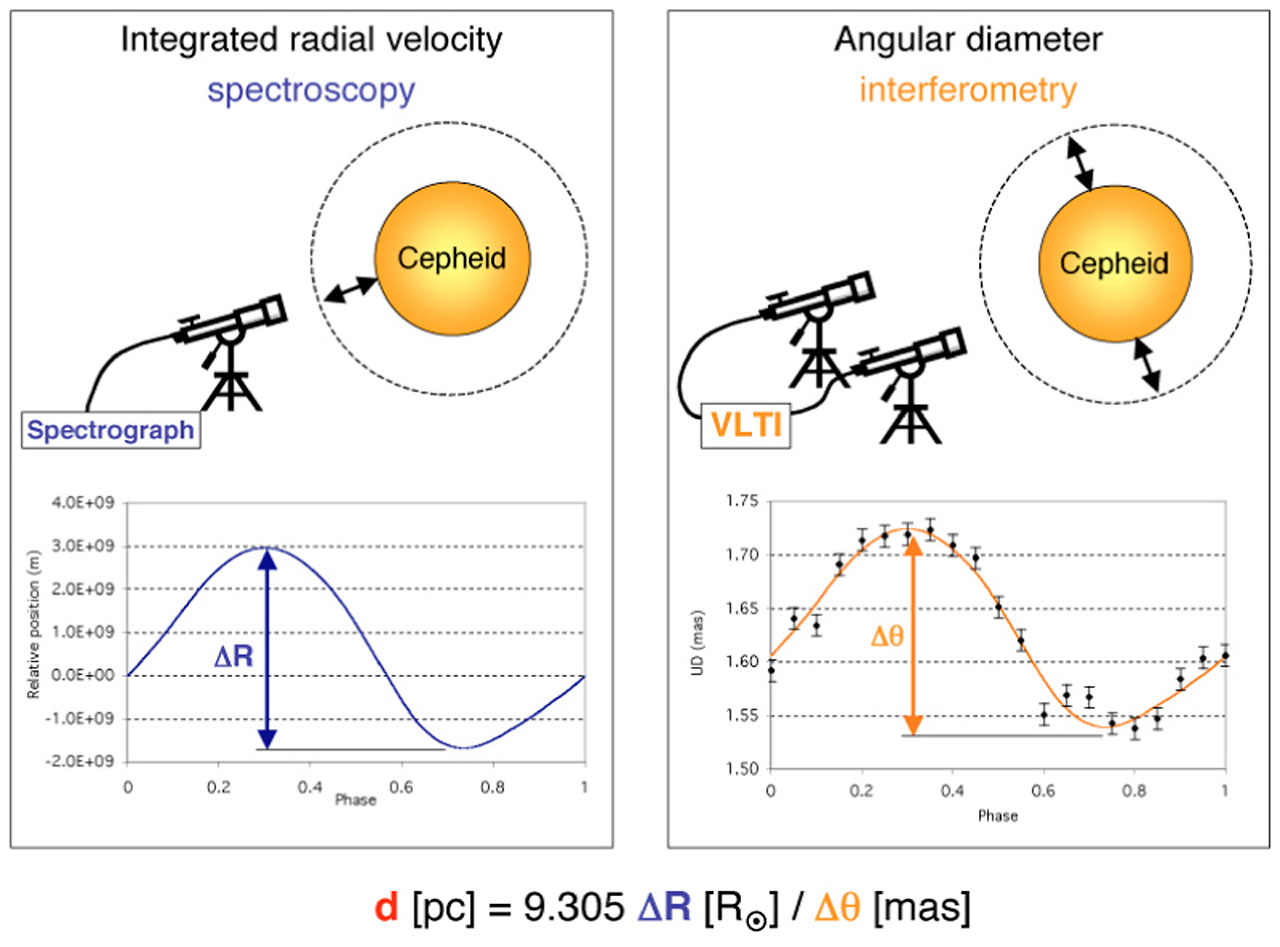
Globular cluster luminosity function as distance indicator
(Submitted on 18 Jan 2012)
Globular clusters are among the first objects used to establish the distance scale of the Universe. In the 1970-ies it has been recognized that the differential magnitude distribution of old globular clusters is very similar in different galaxies presenting a peak at M_V ~ -7.5. This peak magnitude of the so-called Globular Cluster Luminosity Function has been then established as a secondary distance indicator.
The intrinsic accuracy of the method has been estimated to be of the order of ~0.2 mag, competitive with other distance determination methods. Lately the study of the Globular Cluster Systems has been used more as a tool for galaxy formation and evolution, and less so for distance determinations. Nevertheless, the collection of homogeneous and large datasets with the ACS on board HST presented new insights on the usefulness of the Globular Cluster Luminosity Function as distance indicator.
I discuss here recent results based on observational and theoretical studies, which show that this distance indicator depends on complex physics of the cluster formation and dynamical evolution, and thus can have dependencies on Hubble type, environment and dynamical history of the host galaxy. While the corrections are often relatively small, they can amount to important systematic differences that make the Globular Cluster Luminosity Function a less accurate distance indicator with respect to some other standard candles.
| Comments: | Accepted for publication in Astrophysics and Space Science. Review paper based on the invited talk at the conference "The Fundamental Cosmic Distance Scale: State of the Art and Gaia Perspective", Naples, May 2011. (13 pages, 8 figures) |
| Subjects: | Cosmology and Nongalactic Astrophysics (astro-ph.CO) |
| DOI: | 10.1007/s10509-012-0986-9 |
| Cite as: | arXiv:1201.3936 [astro-ph.CO] |
(or arXiv:1201.3936v1 [astro-ph.CO] for this version)Planetary Nebula Luminosity Functions For Distances to Galaxies
 For more information about planetary nebula luminosity functions (PNLF), see the pages listed below: 
|


